Tracing with cats-tagless and ZIO
Tracing can be a good tool to gain in-depth insights in problems you might have in your application.
Tracing can be a good tool to gain in-depth insights in problems you might have in your application. Why does this call take so long? What caused this specific error? Where in my distributed system did the process stop? Tracing be a tool to find out some of these causes.
I used a specific set of tools to gain these insights. To be more specific:
- OpenTracing which provides a tracing implentation in Java
- ZIO for running effects and propagate to the right
Span - cats-tagless for transforming tagless final interfaces to provide instrumented versions
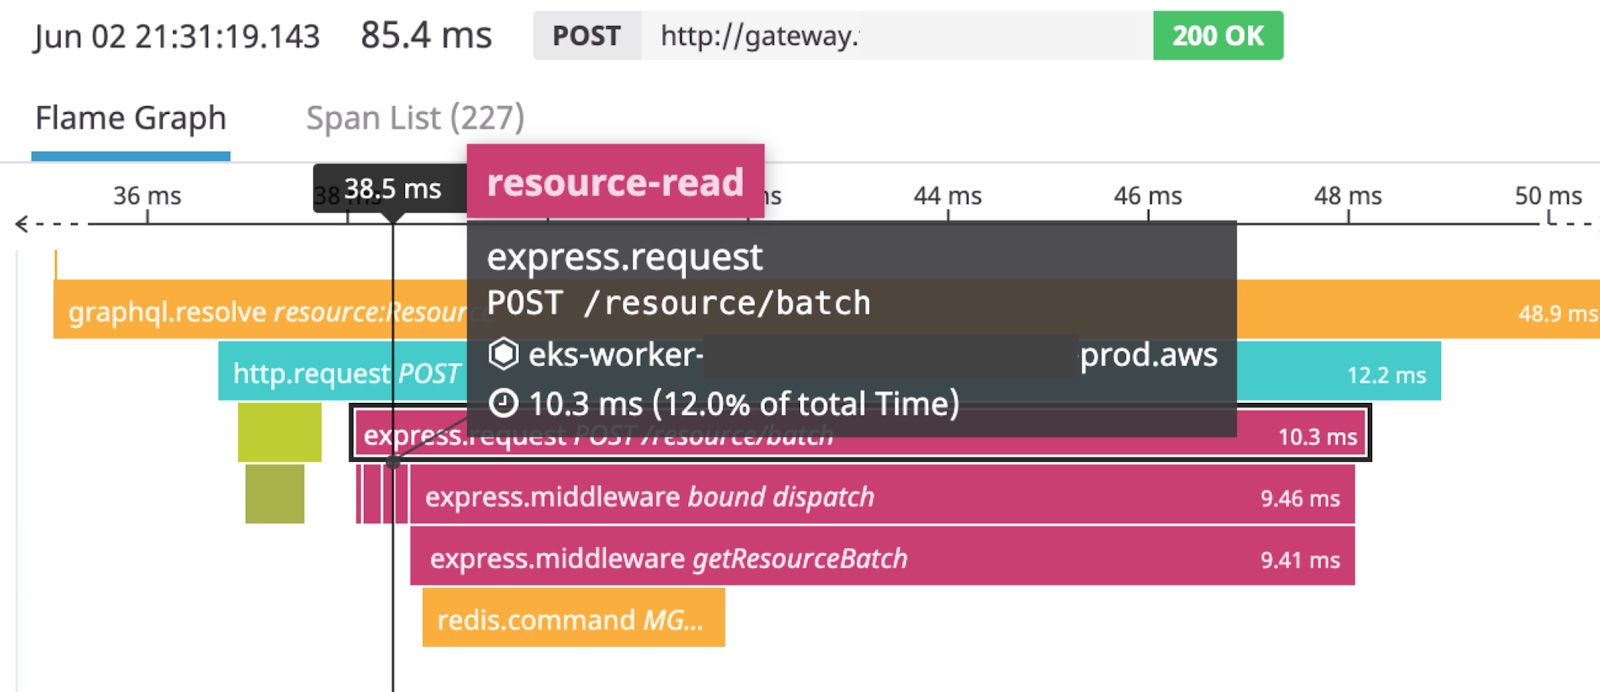
How does a trace look like ? In Datadog it looks like this

OpenTracing
OpenTracing is comprised of an API specification, frameworks and libraries that have implemented the specification, and documentation for the project. OpenTracing allows developers to add instrumentation to their application code using APIs that do not lock them into any one particular product, programming language or vendor.
The most important concept of OpenTracing is a Span. A Span represent a unit of work, you can attach tags or logs to a spawn and it has a start and end time. You can nest Span inside eachother, such that you can see what’s going on.
ZIO
ZIO is library for modelling (a)synchronous effects inside your application. Typically a tracing application relies on ThreadLocal of Java to keep the current Span. However in ZIO you don’t have that and you can use a FiberRef which allows you to store a local Span.
A very simple implementation could look like this:
trait Backend {
  def root(operationName: String): UIO[Span]
  def child(operationName: String, parent: Span): UIO[Span]
  def close(span: Span): UIO[Unit]
}

object Backend {
  def opentracing(tracer: Tracer): Backend = new Backend {

    def root(operationName: String): UIO[Span] =
      UIO(tracer.buildSpan(operationName).start())

    def child(operationName: String, parent: Span): UIO[Span] =
      UIO(tracer.buildSpan(operationName).asChildOf(parent).start())

    def close(span: Span): UIO[Unit] = UIO(span.finish())
  }
}


trait Tracing {
  val tracing: Propagator
}

object Tracing {
  def apply(propagator: Propagator): Tracing = new Tracing {
    val tracing: Propagator = propagator
  }
}

class Propagator(backend: Backend, ref: FiberRef[Span]) { self =>
  def get: UIO[Span] = ref.get
  def useChild[R, E, A](operationName: String, use: ZIO[R, E, A]): ZIO[R, E, A] =
    ZIO.bracket(get.flatMap(backend.child(operationName, _)))(backend.close) { span =>
      ref.locally(span)(use).provide(Tracing(self)))
    }
}

object Propagator {
  def make(backend: Backend, initial: Span): UIO[Propagator] =
    FiberRef.make(initial).map(new Propagator(backend, _))
}
The most important method here is the useChild method on Propagator. It uses bracket to run an computation. The allocate will start a new Span and after running the computation it will finish the current Span.
On every HTTP we receive we create a Propagator like this. I’ve used http4s:
def trace(name: String)(operation: Propagator => Task[Response[Task]]): Task[Response[Task]] =
    for {
      tracer     <- UIO(OpenTracing.tracer)
      rootSpan   <- UIO(tracer.buildSpan(name).start())
      propagator <- Propagator.make(Backend.opentracing(tracer), rootSpan)
      resp       <- operation(propagator).ensuring(UIO(rootSpan.finish()))
    } yield resp
In my backend I don’t use Tapir or any endpoints library, but if you do you can generate the name of each transaction by generating an endpoint name.
An example of running a service method which is bound to an http4s endpoint looks like this.
val unsecured: HttpRoutes[Task] = HttpRoutes.of {
    case GET -> Root :? CityMatcher(city) +& PostalCodeMatcher(postalCode) =>
      trace("GET /geo") { prop =>
        GeoService.lookup(postalCode, city).provide(env.withTracing(prop)).flatMap(Ok(_))
      }
  }
To actually trace something in our service methods we need to have access to the Propagator. The Tracing provides that dependency. So I’ve defined a convenient alias for this:
type Traced[+A] = RIO[Tracing, A]We eliminate the need of the dependencies by calling the provide method of ZIO. The dependencies are defined with a cake pattern. The signature of the GeoService.lookup method looks like this:
def lookup(postalCode: Option[String], city: Option[String]): RIO[AddressClient.Component[Traced] with Tracing, Location]For example if you would require database access, you would include Postgres. As you can see the client for talking to an address API is included as well. Actually my Postgres trait extends Tracing. All the calls to the repositories are of Traced. The env instance here is actually a case class which implements all the dependencies defined in the application.
The default Tracing implementation uses a NoopBackend which is overriden by the withTracing (which is just a simple case class copy).
So what does cats-tagless has to do with this?
cats-tagless
cats-tagless provides powerful macros to work with tagless final algebras.
Why?
Why would you bother using tagless final when you have ZIO ?
I like to use tagless final algebras for the side-effectful components of my systems because it allows you to write down abstractly a effectful method, without getting to specific on the effect type of the method.
I always implemenent the algebra with the least powerful abstraction, such that it stays flexible to swap any effect you would like. This means using MonadError or Applicative as effect constraint.
Using the least powerful abstraction makes your program less concerned about other stuff. It will only be able to flatMap and throw an error. The power ZIO provides is not used yet.
Delaying the use of ZIO allows us to write laws of our algebras and more importantly deal with other concerns at a higher level. These concerns are:
- Circuit breaking
- Tracing
- Metrics
- Logging
I explain how to apply tracing in this blog, but you could very well use this approach for logging or metrics as well.
Tracing ConnectionIO
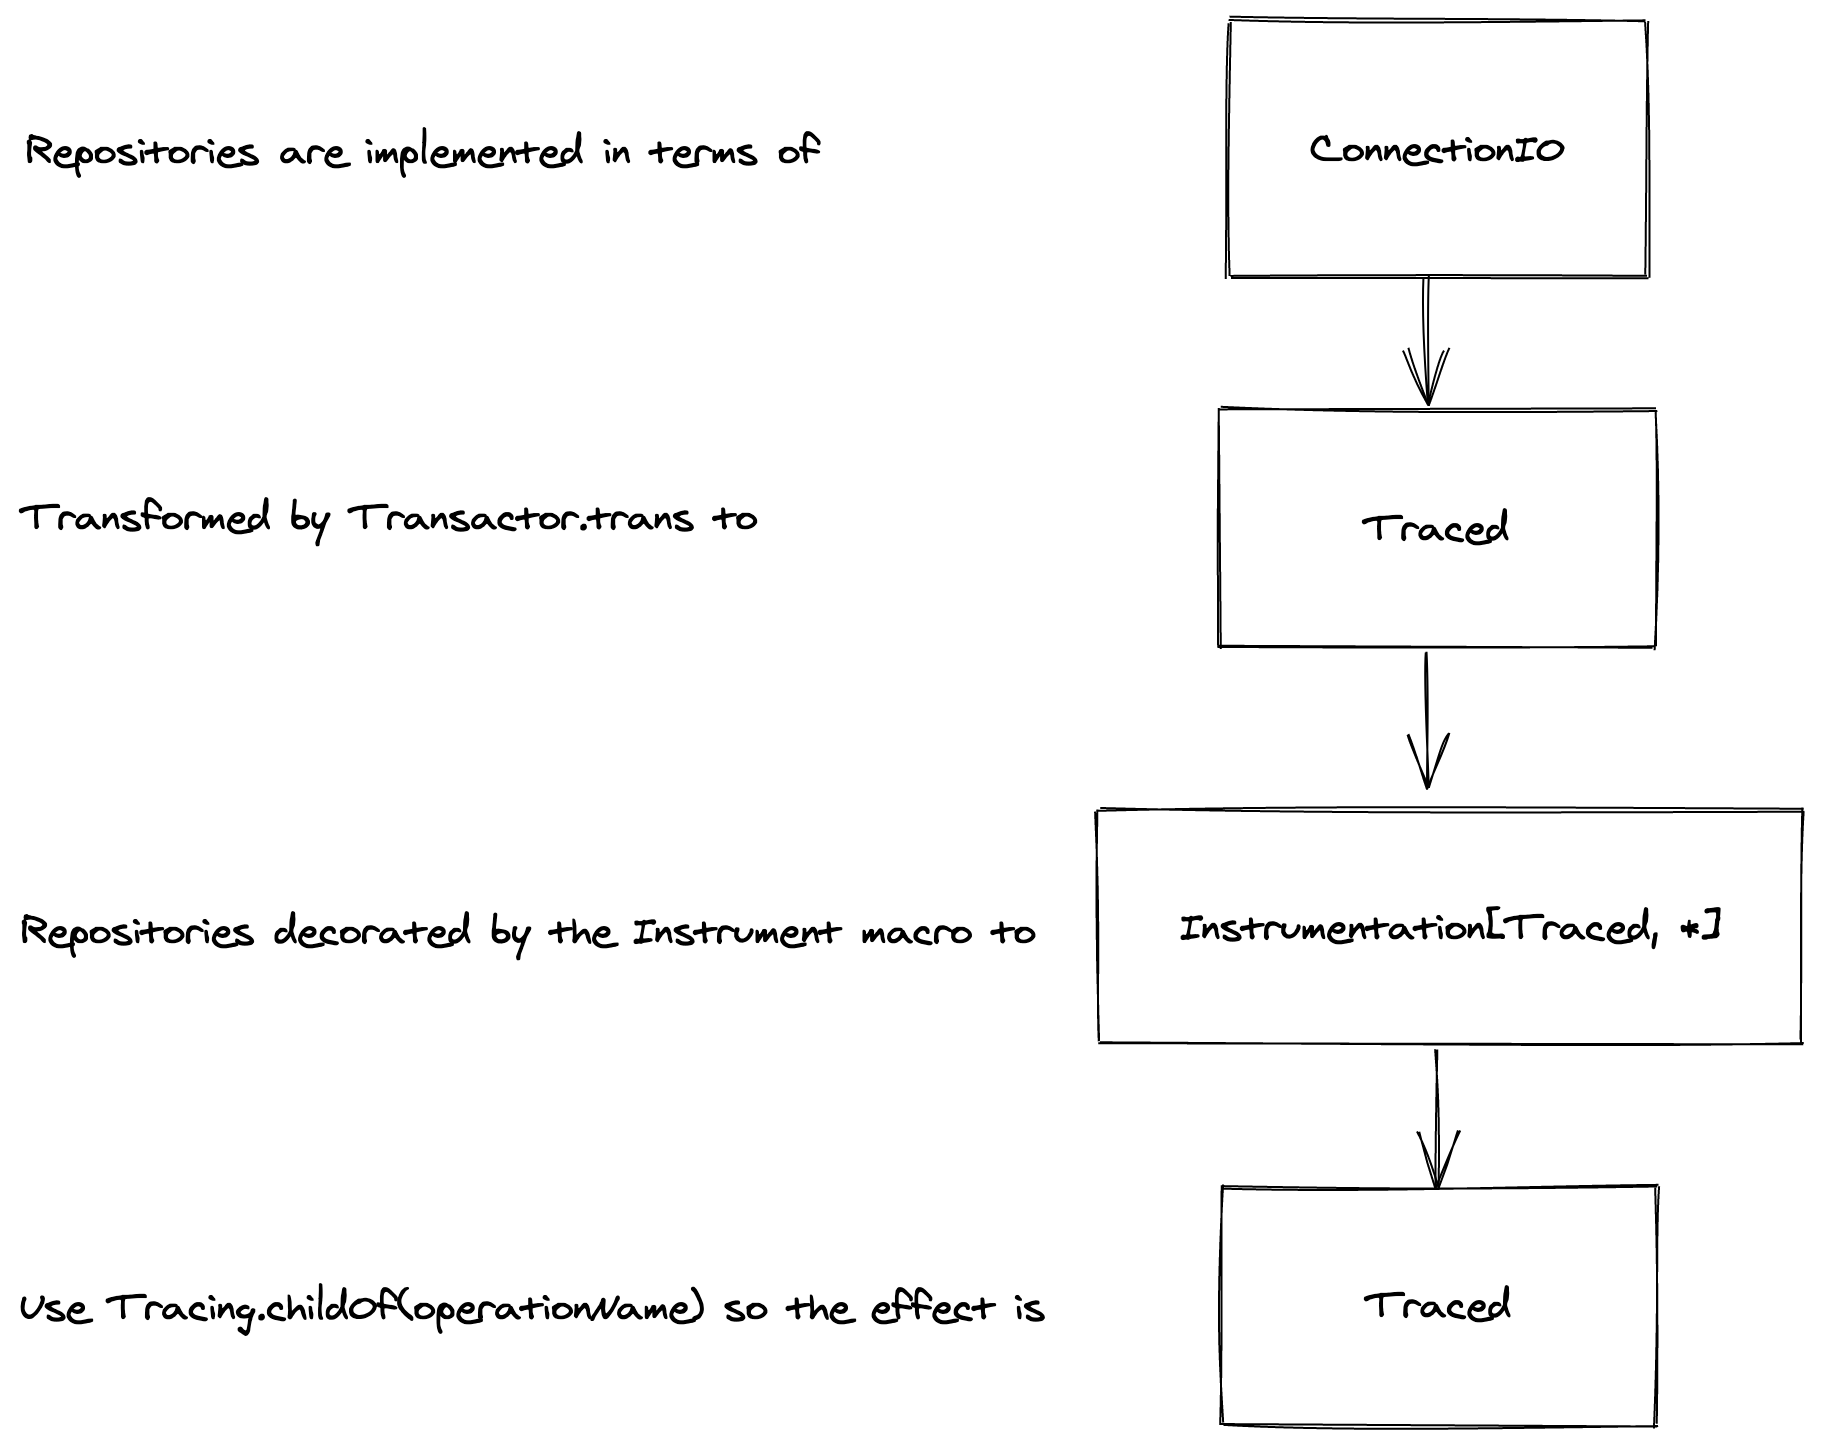
For example, all my repositories (which are tagless final algebras) are implemented in terms of ConnectionIO from Doobie. Why?
- You can compose
ConnectionIOto create transactions - You can lawfully test the repositories by running multiple
ConnectionIOstatements, get the result and rollback the transaction to not even affect your database. - With cats-tagless you can transform the complete tagless final algebra by using
FunctorKto a ZIOTaskorTracedwhich we use.
The repositories are transformed in the following steps

Now every method call to a Repository includes the name of the algebra and the method name. I’ve used a specialized Transactor which includes the SQL statements and also traces how long a query takes.
How does that translate to code?
@autoFunctorK
@autoInstrument
trait Locks[F[_]] {
  def acquire(host: String, service: String): F[Int]
}
The code which explains the steps to transform
// Repository implementation in terms of ConnectionIO
val doobie: Locks[ConnectionIO] = ???

// The natural transformation which transforms ConnectionIO to Traced
val xa: ConnectionIO ~> Traced = TracedTransactor.trans

// Transform the ConnectionIO repository to a Traced implementation
val traced: Locks[Traced] = doobie.mapK(xa)

// The natural transformation to include a `Span` and operationName
val instrumentToTraced: (Instrumentation[Traced, *] ~> Traced) =
	new (Instrumentation[Traced, *] ~> Traced) {
		def apply[A](fa: Instrumentation[Traced, A]): Traced[A] =
		  ZIO.accessM(_.tracing.useChild(show"${fa.algebraName}.${fa.methodName}", fa.value))
	}

// The instrumented version by using the Instrument macro and apply the instrumentToTraced
val instrumented: Locks[Traced] = traced.instrument.mapK(instrumentToTraced)
Tracing HTTP
I also use tagless final for interacting with external API’s such as Keycloak. In Scala I use keycloak4s, which offers a extensive API built upon sttp. The nice thing about sttp is that you can plugin your own backends. I build a custom backend which works with the Traced effect such that HTTP calls can be traced accross multiple services.
class TracingSttp(other: SttpBackend[Traced, Nothing]) extends SttpBackend[Traced, Nothing] {

  def send[T](request: Request[T, Nothing]): Traced[Response[T]] = {
    def action = {

      def prepareTags: Traced[Unit] =
        tag(
          "span.kind"   -> "client",
          "http.method" -> request.method.m,
          "http.url"    -> request.uri.toString()
        )

      def extractHttpHeadersFromSpanContext: Traced[Map[String, String]] =
        ZIO.accessM(_.tracing.httpHeaders)

      for {
        _       <- prepareTags
        headers <- extractHttpHeadersFromSpanContext
        resp    <- other.send(request.headers(headers))
        _       <- tag("http.status_code" -> resp.code)
      } yield resp
    }

    action.instrumented(show"${request.method.m} ${request.uri.path.mkString("/")}")
  }

  def close(): Unit = other.close()

  def responseMonad: MonadError[Traced] = implicitly[MonadError[Traced]]

}
You can continue your trace accross asynchronous boundaries by encoding the trace id in the HTTP headers and decode it when you process the request on the other end. This also works with Kafka, you could add the tracing state inside a header of Kafka envelope. There are more integrations, this will also work for gRPC for example, checkout the opentracing-contrib.
Closing words
Tracing is a nice tool to do root cause analysis and find bottlenecks. OpenTracing, a standard implemented in multiple languages along with ZIO’s FiberRef and cats-tagless can be used to build a non-intrusive way of adding tracing to your application.
Credits to Tamer Abdulradi for his work on zio-instrumentation which has been a huge inspiration.